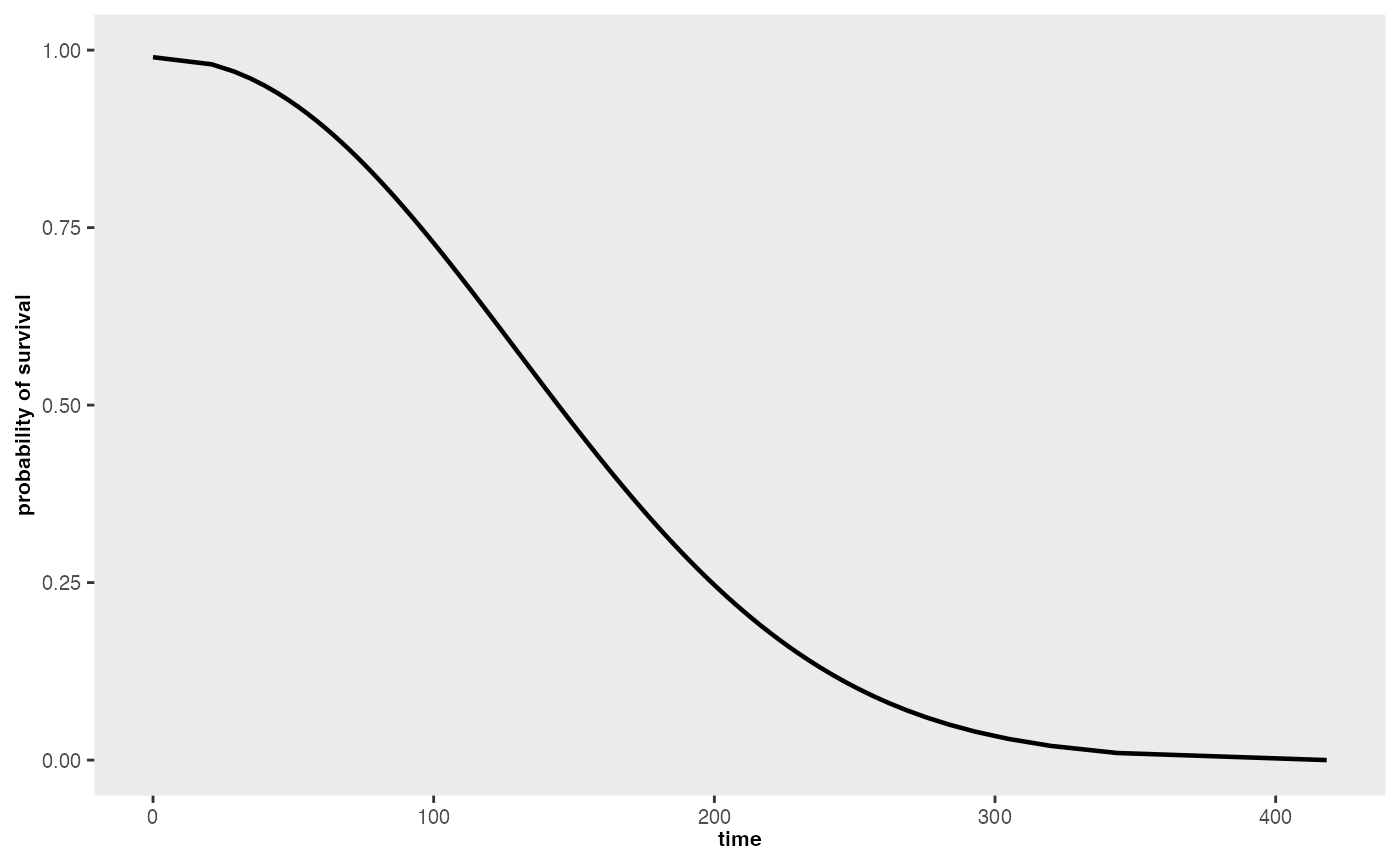
Plot survival curves
survParamPlot(formula, shape, points = NULL, n = 100, scale = 1, limits = NULL)Arguments
- formula
This is the "formula" parameter of the Weibull-based survival curve that can be used to define the scale of the distribution.
- shape
The parameter that defines the shape of the distribution.
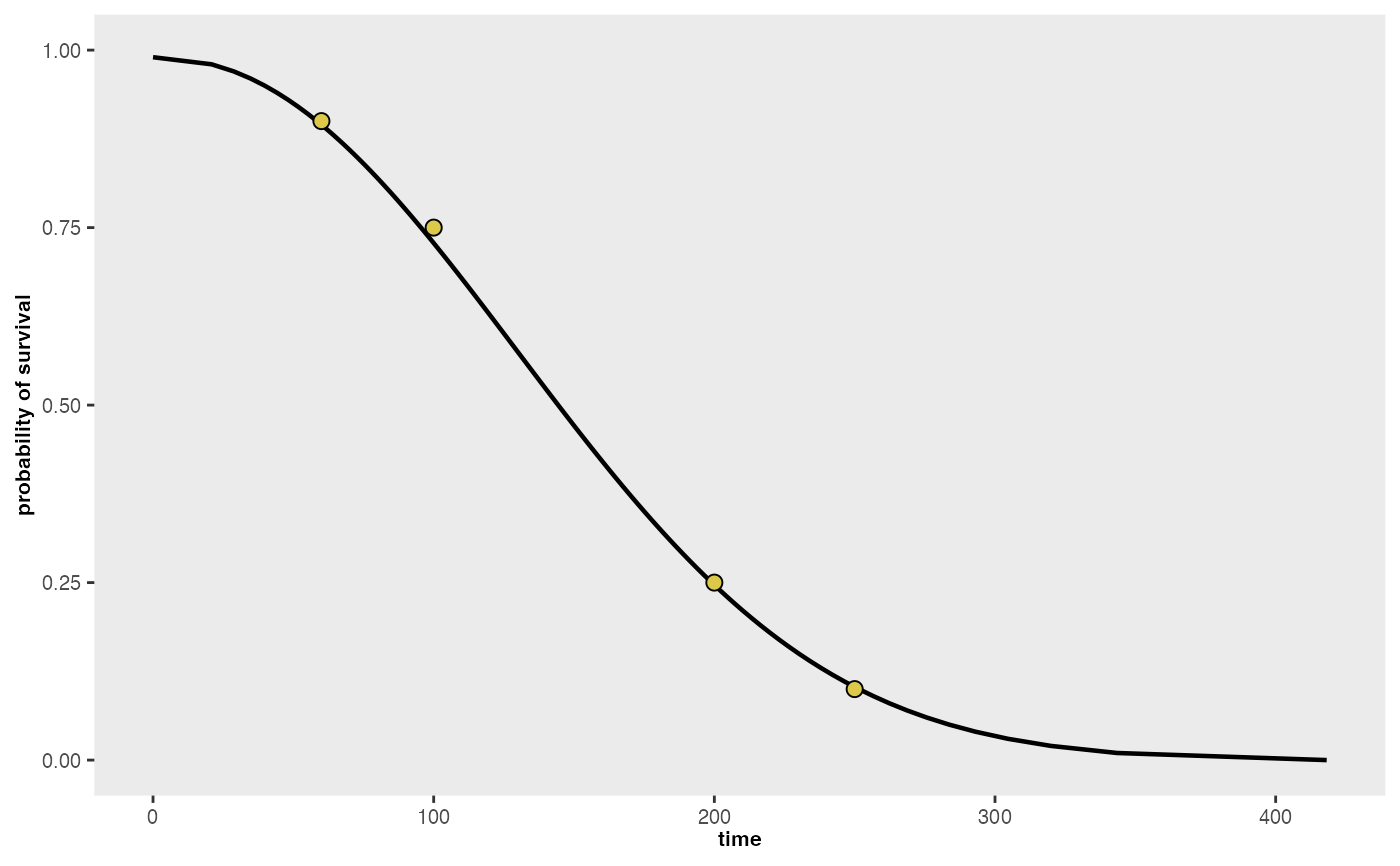
- points
An optional list of two-element vectors specifying the desired time and probability pairs that define the desired survival curve. If no list is specified then the plot will not include any points.
- n
The number of points along the curve that will be used to define the line. Defaults to 100.
- scale
An optional scale parameter that defaults to 1. If the value is 1, the scale of the distribution is determined entirely by the argument "f".
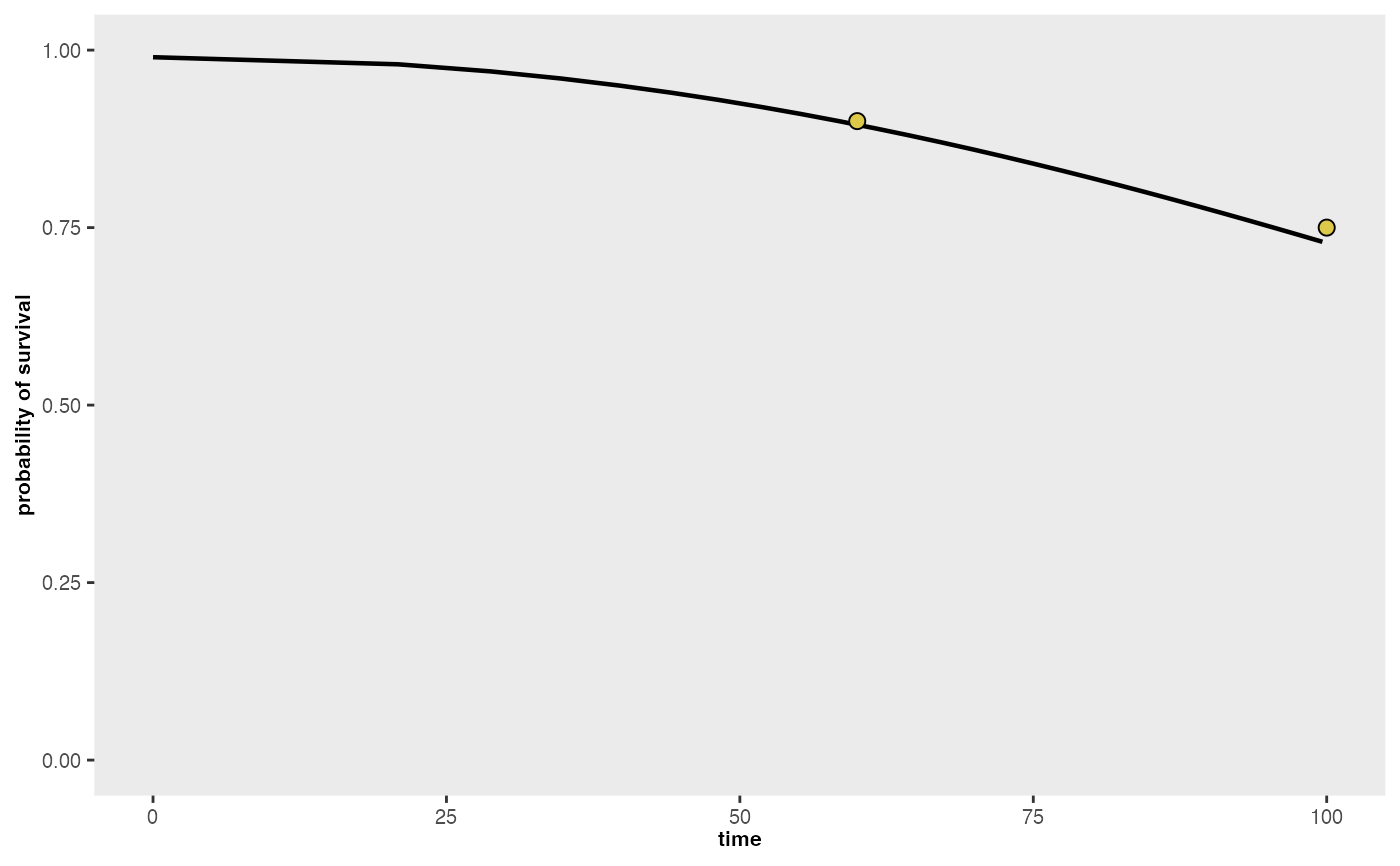
- limits
A vector of length 2 that specifies x-axis limits for the plot. The default is NULL, in which case no limits are imposed.
Value
A ggplot of the survival curve defined by the specified parameters. If the argument points is specified, the plot will include them