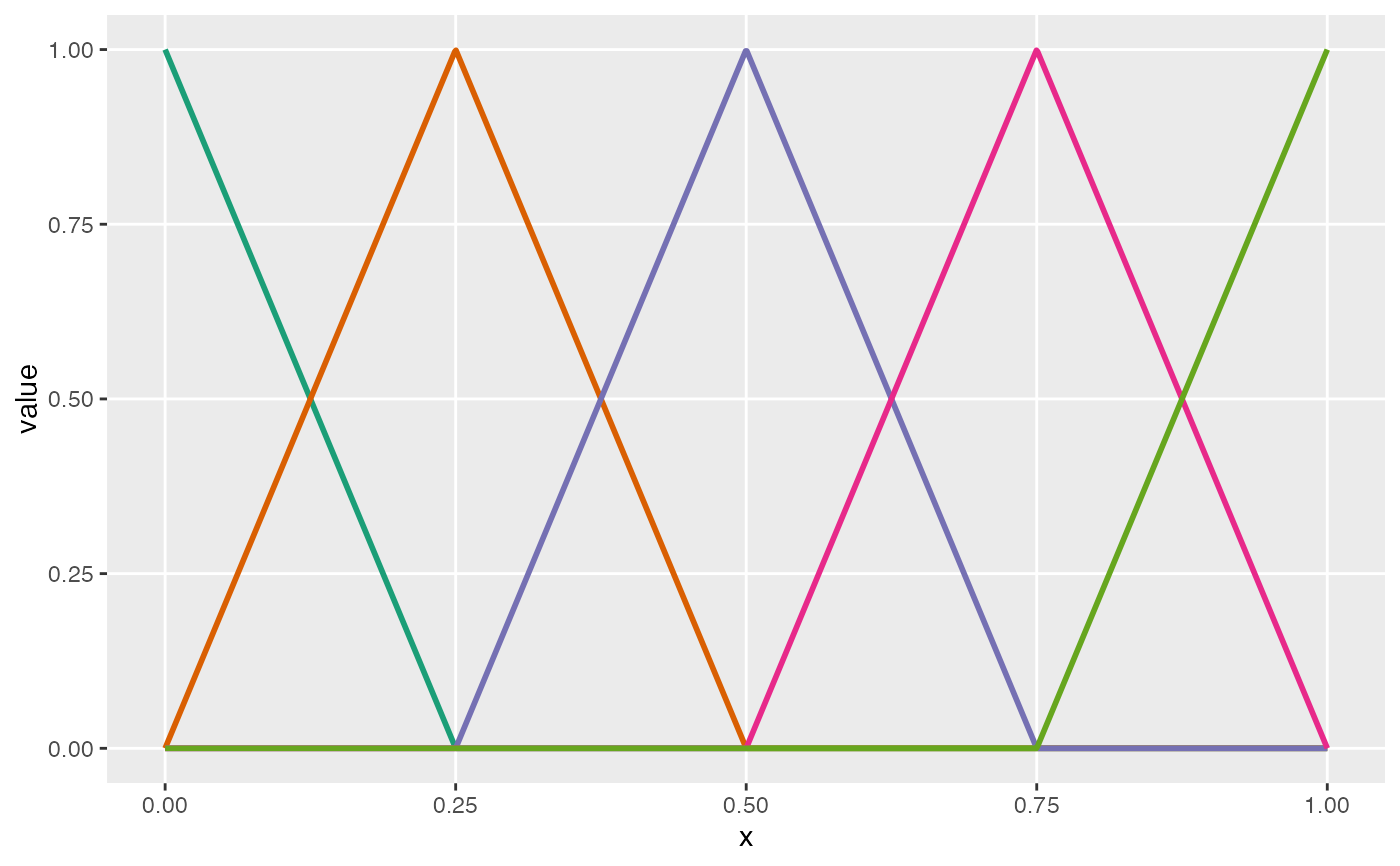
Plot basis spline functions
viewBasis(knots, degree)Arguments
Value
A ggplot object that contains a plot of the basis functions. In total, there will be length(knots) + degree + 1 functions plotted.
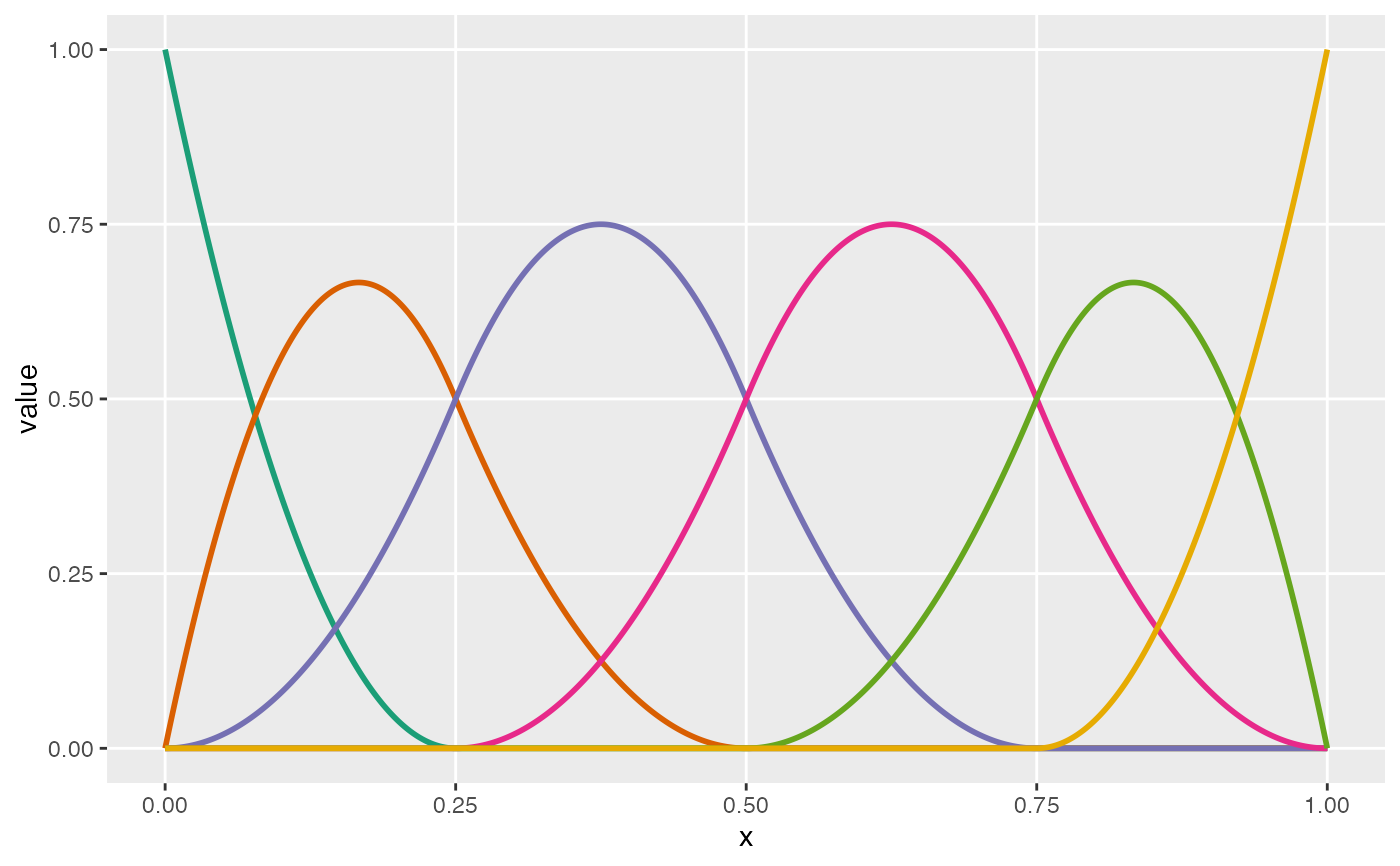
Plot basis spline functions
viewBasis(knots, degree)A ggplot object that contains a plot of the basis functions. In total, there will be length(knots) + degree + 1 functions plotted.